Stop Struggling with People Analytics
I know very well how daunting experience is to start your journey with people analytics. It takes time to understand all aspects and elements of people analytics. Overall people analytics mission is to enable value from people data and reveal insights to improve business outcomes. This sounds simple but applying people analytics in a company is not simple at all. Additionally, the wide range and complexity of available materials describing this domain is only hindering rookie’s efforts.
Therefore, I created the Applied People Analytics model which intends to explain basics of people analytics. It will equip you with arguments to convince your decision makers to invest in PA. Additionally, after breaking down, the model will provide practical guidance of how to implement people analytics in your organization.
Would you like to meet me at a webinar? On 26th of April, I will be a guest in a webinar organized by Professor Andrzej Sobczak. The webinar will be held in Polish. The subject is: “People analytics w działach IT i firmach technologicznych”. You can register here: LINK.
Also, on 19-20 April I will be attending People Analytics World conference in London. If you are also there, I will be very happy to meet you to either say ‘Hi!’, or to have a chat about people analytics and data-driven HR.
In this issue:
- Applied People Analytics
- 14 HR Metrics Examples
Enjoy!
Applied People Analytics
Many companies and individuals are struggling with people analytics.
It happens because it's complex to implement PA operating model and get value from it. Still, the operating model is just a tip of an iceberg because what is key to success is hidden below the surface of dark cold water.
People analytics is very large domain. When speaking about PA we might have in mind one or many of the below:
- HR reporting and HR dashboards,
- Data-driven HR,
- People analytics operating model in an enterprise,
- HR metrics,
- Data literate HR,
- Advanced analytics performed on HR data,
- HR data crunching,
- Testing hypothesis via data science performed on HR and non-HR data.
As you see, it could become extremely confusing for a newbie in the field to get a grasp of what people analytics really is and where to start working on it.
Knowing this and still remembering my struggles in my beginnings, I want to contribute to the development of people analytics field by describing practical model of implementation people analytics in an enterprise. I called the model Applied People Analytics.
This is the very first iteration of the model. I know it isn’t perfect. My model is strongly influenced by David Green’s and Jonathan Ferrar’s 9 dimensions model from their terrific book Excellence in People Analytics. My second big inspiration is Max Blumberg Business-driven HR operating model that I felt in love from the first sight.
I want to make my model as much practical as possible. Next, I will break down the model to processes that will be manageable to plan and implement. Of course, processes will require adjustments to individual needs and situation within a company, but they should serve as a guiding star to practitioners who seek to get to grip with people analytics.
But let’s park the processes for now and focus on the model itself.
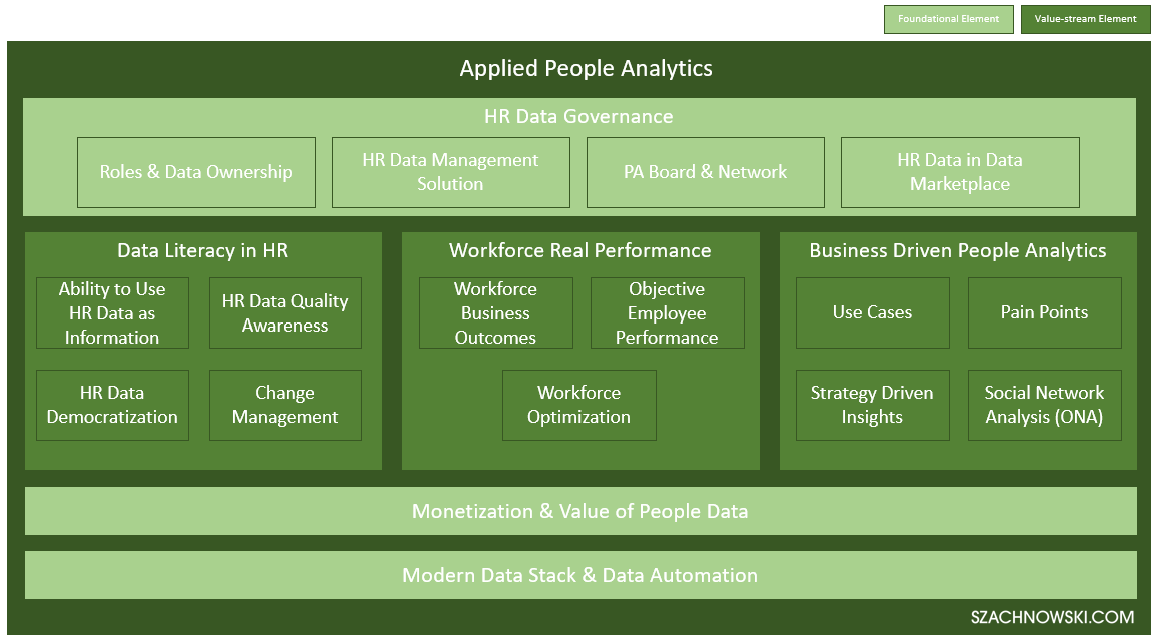
The Applied People Analytics model contains 3 foundational elements and 3 value-stream elements.
Foundational elements are:
- HR Data Governance,
- Monetization & Value of People Data, and
- Modern Data Stack & Data Automation.
Value-stream elements are:
- Data Literacy in HR,
- Workforce Real Performance, and
- Business Driven People Analytics
HR Data Governance secures proper roles and responsibilities regarding HR data management and ownership. Also, it ensures data quality process is in place and that all HR data is defined in data catalogue. Regarding ethics, privacy, and security HR Data Governance establishes People Analytics Board which support the organization and provide guidelines. And lastly, HR Data Governance secures that HR data is present in company-wide data marketplace.
Monetization & Value of People Data is the ability to measure and express value of data with figures. If we don’t have HR data we have to produce or buy it. Therefore, HR data valuation can be represented in money and serve as a basis for use cases, pain points, and PA projects ROI.
Modern Data Stack & Automation. Let’s put the famous build or buy question aside and focus on the generated impact. Foundation technology ingests raw HR data from multiple sources and enables scaled application of people analytics in the company. This is achieved throughout data pipelines and data automation. It serves all actors from HR to Data Scientists.
HR Data Literacy, in short, secures that HR folks can read, understand, create, and communicate HR data as information. It ensures data quality awareness and HR data democratization, as well as change management activities to transform HR function to become data-driven.
Real Workforce Performance generates value by answering questions about real business outcomes. Like sport players are described by statistics, our employees are described by HR data we collect and process. Let’s make good use of it to improve business outcomes but also to help our employees shine and grow. Real Workforce Performance helps define objective workforce performance metrics and provides workforce optimization guidelines, ex. by supporting informed decisions on optimal team size , structure, and collaboration model.
Business Driven People Analytics are data-driven opportunities translated into practical use cases and pain points. It establishes data-driven culture close to the Business-driven operating model by Max Blumberg. It helps to identify and adjust collaboration patterns thanks to social network analysis (ONA) and provides strategy driven insights.
These elements of the model should be broken down into smaller manageable chunks. Every company is different and has its own challenges and opportunities. Hence, the model should be adjusted accordingly to the needs. However, all elements are important to build business-driven, value oriented, scalable people analytics function.
I’ll keep working on the Applied People Analytics Model. Therefore, you can expect more about it in coming weeks and months.
In the meantime, I’d like to ask you for your feedback. This is version 0.1 of the model. I know it has flaws and gaps. It lacks clarity and taxonomy might be confusing. Except of this article, I described this model on LinkedIn, and I’ll be happy to read your comments there. You can also share your feedback or questions to me directly via email.
What element of the model you would like me to elaborate on next?
14 HR Metrics Examples
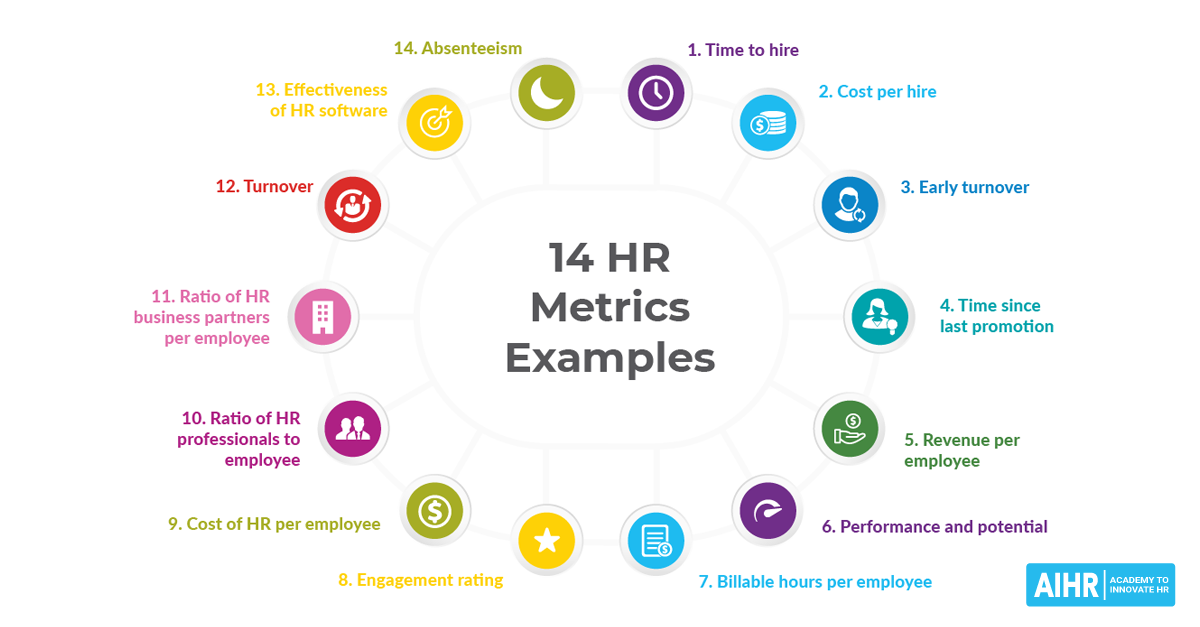
Below are some core HR metrics used to track and measure performance of different aspects of HR and business. Your people are your key business asset and often one of the biggest cost elements in the company. Thus, it’s good to measure HR.
- Time to hire. It measures the number of days between engaging a candidate and then accepting a job offer.
- Cost per hire. This metrics shows how much it cost the company to hire new employees.
- Early turnover. This metric shows the percentage of recruits leaving in the first year.
- Time since last promotion. This metric is useful in explaining why your high performers leave.
- Revenue per employee. This metric shows the efficiency of the organization as a whole. It’s calculated by dividing the company’s revenue by the total number of employees.
- Performance and potential. The 9-box grid measures and maps both and individual’s performance and potential in three levels.
- Billable hours per employee. This metric refers to the employee utilization rate which refers to the amount of working time employee is spending on billable tasks.
- Engagement rating. People who like their job and who are proud of their company are generally more engaged. Additionally, team engagement is an important metric for a team manager’s success.
- Cost of HR per employee. The metric shows cost efficiency of HR expressed in currency.
- Ratio of HR professionals to employees. It is a measure of HR’s cost efficiency.
- Ratio of HR Business Partners per employee. The same as previous one, this measure shows HR efficiency.
- Turnover. It shows the number of leavers compared to the total population in the organization. It expresses how many employees have left the company in a given year.
- Effectiveness of HR software. Effectiveness of, for instance, learning and development software are measured in the number of active users, average time on the platform, session length, total time on platform per user per month, screen flow, and software retention. These metrics enable HR to determine what works for the employees and what does not.
- Absenteeism. It is a strong indicator of dissatisfaction and prediction of turnover. Differences between individual managers and departments are very interesting indicators of (potential) problems and bottlenecks.
Inspiring quote
“If you want to hire great people and have them stay working for you, you have to be run by ideas, not hierarchy. The best ideas have to win, otherwise good people don't stay.” – Steve Jobs
Want to be a Sponsor?
Would you like to be a sponsor of my newsletter? Contact me: sebastian@szachnowski.com.
Thank you for reading my newsletter! I’ll be delighted to get your feedback about the newsletter and this issue.
Do you know someone who might be interested in this newsletter? Share it with them.
You can also:
- Subscribe to my newsletter https://szachnowski.com/
- Connect with me on LinkedIn https://www.linkedin.com/in/sebastianszachnowski/
- Follow me on Twitter https://twitter.com/sszachnowski
- Send me an email sebastian@szachnowski.com