From Data Product to Acting on Insights

Even the best analysis and insights are pointless if they weren’t presented properly and to the right audience. Yet, the best presentation spiced with top-notch storytelling will not create any value if people don’t act on the results. Therefore, you will need a process to receive expected business outcomes from your analytics projects.
People analytics is a process and should be structured like a process. In this issue of my newsletter, I curated information and articles which draw an outline of how complete and generic analytics process could look like. I know this is just the tip of an iceberg, as such overall description is not a process per se. However, let’s start here and we will progress together by learning the basics and then modelling the people analytics process during following weeks and months.
People analytics require competences sometimes referred as part of HR competences of the future. In this context, did you know that most companies treat learning as a cost rather than investment and only 4% of companies report on the outcomes of their skill-building programs in terms of business outcomes? You can read about this and more in my summary of a recent BCG publication about skills.
Table of contents:
· What Is Data Product?
· Analysing Data: What Is It?
· Presenting Your Insights
· You Should Have Skills Linked to Your Strategy
This is the 10th issue of the newsletter. I’d like to thank you to all my subscribers and readers. It is great pleasure and fun to write for you. Thank you and I look forward to delivering you more content to you in the future.
Since I write this newsletter for you, I will appreciate all the feedback regarding my work. Do you like my newsletter? Share it with your friends who may be interested. Share it in your social media. Follow me on LinkedIn and leave feedback. I appreciate all your actions as it helps me to reach larger audience, and this is the biggest gratification for my work.
What Is Data Product?
The aim of data products is to help businesses to make better choices and procedures. With help of data products, it is possible for non-data scientists to do many types of analysis on large datasets with an intuitive user interface. Data products build capability to make educated business decisions based on data.
The right data helps companies acquire new customers, increase revenue, and improve the lifetime value from the customers. If incorrect data is used, brand reputation, growth, and client acquisition may all be negatively affected.
It starts with distributed ownership
With data products there are no longer any boundaries between data experts and business stakeholders who know how to utilize the data. Domain specialists have the authority to act as data product managers, in charge of securing right standards of quality, reliability, security, and efficiency. In addition, if data products are part of corporate architecture, central governance, guidelines, and control may increase their effectiveness.
Trust is built via the use of data products
Major issue for business is data quality. Many corporate users have little trust in data quality and accuracy. With data products we can collect high quality data and make it simple to locate, understand, and consume.
Provide easy self-service to a wider audience
Non-technical consumers may engage with data via data products. Authorized people with right reason to use data may quickly assess whether a data product fulfils their needs with the use of self-service, digital storefront search, preview, and preliminary filtering and analysis.
Cycles of value production should be used instead of one-off activities
When combined or modified, data products may serve as the foundation for new tailor-made data products. When a new data product is exchange in data exchange (ex. data marketplace tool), it benefits a large number of (new) business stakeholders.
Increased opportunities are available when considering the whole ecosystem
Data product management allows you to keep track of who has access to each product and what they have done with it. You can also use third-party data in your data products.
Operate more efficiently using data
Subscribers to a data product are automatically sent to their selected destination. Data is updated thought a totally automated data pipeline. Information consumption is enabled for future enhancements by product managers. Business can build smart data apps that are purpose-built to address specific problems. The whole lifecycle management of a data product is straightforward.
Data products help release people from time and effort to gathering, cleaning, and organizing data. Data wrangling is labour-intensive and time consuming when done manually. Using data product data analyst may speed up analysis process and focus on the value and looking for insights.
Easy-to-use features are critical when creating a data application that can be widely accepted and scaled. Data products, like beta tests, should be enhanced based on input from users who are really using the program. You may save money and time by analysing and improving your company’s operations with the use of data. Regardless matter the size of the organization, waste has a negative impact. A waste of time and money, it eventually affects the bottom line.
Source: https://tesseract.academy/what-is-a-data-product-and-how-they-are-useful-for-businesses/
Analysing Data: What Is It?
Analysing data means collecting it, transforming and organizing in order to draw conclusions, make predictions and make data-driven, informed decisions.
The idea is to understand the data you have, analyse it, share the prospects for a better business in the near future and extract useful information. This is the kind of business intelligence that is being used today to generate profits and make better use of resources. It also helps improve management processes and take your organization to the next level.
There are six phases in data analysis to get clean, unbiased, and meaningful data:
- Ask
- Prepare
- Process
- Analyse
- Share
- Act
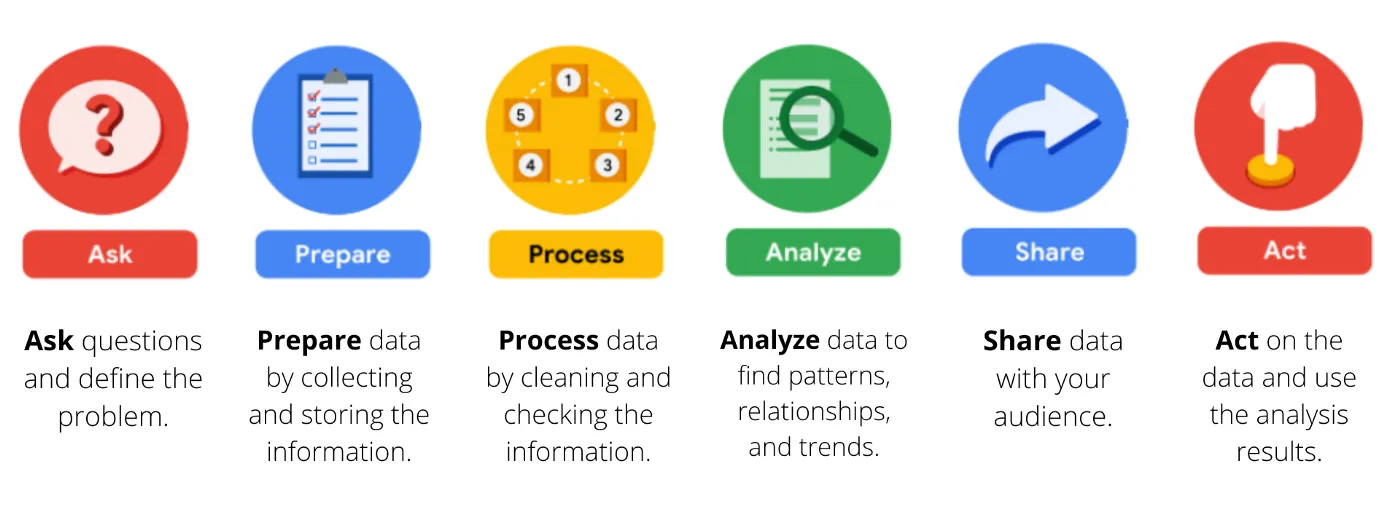
Asking questions helps identify what the analysis project would look like and what is the successful result. It’s crucial to ask questions to stakeholders to understand their expectations and what problem the project should address at the end. Why are you doing the project? What are you looking for? What should the analysis prove? How will the analysis benefit the stakeholders?
To achieve the desired level of success, we need to prepare before we begin the project. Identification of data is heavily needed to achieve results. Without preparation, it is very difficult to understand the path to task completion. What does data mean? Is data unbiased? Is data clean? How can the data be used to help you reach your goals? It’s imperative that you ask these questions first and clarifies them to get clean and unbiased result of the analysis.
Processing data means data is being stored, collected, managed and protected. It is one of the most important phases of data analysis. To achieve that you should use proper tools to find incorrect and incomplete data. You should remove all inconsistencies in data, like for example duplicated entries. One of the most important aspects to keep in mind is identifying whether your data is biased. Data that is biased will not be representative of the population or phenomena you study.
Analysing means using tools to format and transform data. Then sort and filter data, identify patterns and draw conclusions, make predictions and recommendations, and eventually make data-driven decisions.
You have asked right questions, prepared data and processed it to make it clean, organized and formatted. You are ready for analysis. Next, you will generate insights from data to get the answers to questions asked by your stakeholders. Insights are your conclusions you will present to the company to increase business outcomes.
Beauty lies in the eye of the beholder. To share data, we need to make sure it is attractive, simple and easy to explain.
You cannot just go to the meeting with data in Excel sheet that takes hours to explain and make the audience understand the meaning of it. First, you need to understand what visualization to use. Then, create effective visuals. Make sure that the message you want to convey is portrayed by visualizations. Use data storytelling and communicate properly to help other understand results.
You can use visualization tools like Power BI or Tableau to create dashboards and visualizations to make insights more easily understandable and interactive.
Now, it’s time to apply your insights to make precise data-driven decisions. At this stage all that is left is to act on the research.
Source: https://medium.com/@mohajitpaul/analyzing-it-all-a-brief-intro-to-data-analytics-927f0d2901b8
Presenting Your Insights
If you don’t present your insights the right way all your efforts of hypothesizing, research, analysing, modelling, deploying will go waste.
Data scientist should present the work at different steps in the workflow such as:
- At the start, once problem statement is defined present it to various stakeholders to get consensus on expectations and the solution
- Regular reviews to maintain governance and show progress in order to avoid any surprises, risks or miss
- At the end, to present all the analysis, insights, research and model outputs
- Feedback meetings to understand how solution is being used by end users and how feedback can be integrated back to the solution iteratively
Data science can be structured into presentation in following format: Why? What? How?
Slide 1: Cover page
Here you can set the context and describe the process you are solving a problem for. Mention the project or the use case in couple of words.
Slide 2: Why?
Describe the problem statement you are trying to solve. Elaborate on current state and future state once data science or analytics solution is deployed. Mention the pain points and gaps you are trying to address.
Slide 3: What?
Describe your data science or analytics solution and its features. Make use of diagrams, charts, figures, or icons.
Slide 4: How?
Describe how you are solving the problem. Use diagram. Provide details of:
- Training data (scope, size, data sources used)
- Data cleaning/pre-processing performed
- Modelling techniques/algorithms used
- Model outputs/reports/insights/analysis/charts generated
Try to add as many details as possible in it to answer questions from different stakeholders.
Slide 5: Business process flow
Describe the AS IS and TO BE business process flow. This will help to explain if and how the process will change after analytics solution is deployed.
Slide 6: Technical architecture
Describe technical architecture:
- the components used such as Databases, APIs, files, UI, ML engine, applications, metadata manager, data lake, data/model repo, and others
- how data is fetched and stored from various sources
- how the model is deployed via API or inside application
- how model is used by end users via API or web/mobile application
Slide 7: Insights
Describe the key takeaways, insights, conclusions, research outputs of the data analysis. Use charts, graphs, and visualizations to show the insights. Use quantitative figures wherever possible to make show business value. There can be multiple slides to show the insights and conclusion.
Slide 8: Business value
Present details of improved business outcomes or other value generated by the analysis. Visualize, what will be achieved after implementing the data science solution. For example, you can present number of released hours of manual work, value gained in money, savings, and so forth.
Slide 9: Demo
Give demo to the audience of the analytics solution via web or mobile application. Explain the business process flow, how users will interact with the system, if and how users can provide feedback. Customize the demo format and content based on the audience.
Source: https://medium.com/@sourabhpotnis/data-science-presentation-9bd676bed645
You Should Have Skills Linked To Your Strategy
There is a deviation between corporate leaders proclaiming, “our people are our greatest asset” and reality where clearly improving workers’ skills isn’t a top priority. BCG research shows that few companies tie skill building to strategy or report on how they manage skills in the same way they do for other important assets.
The World Economic Forum has estimated that 50% of the global population needs new skills to meet shifts in demand driven by new technologies. By 2030, this figure may grow to as high as 90%. Failing to meet the demand for new skills could cost as much as $15 trillion in lost GDP.
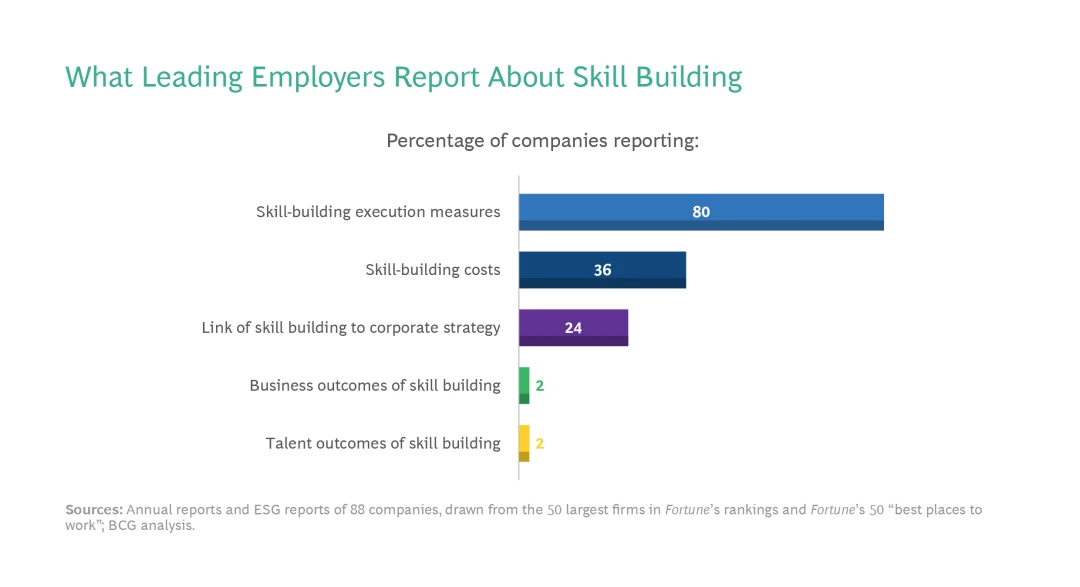
BC has examined the annual reports and environmental, social, and governance (ESG) reports of 88 leading firms chosen from Fortune’s rankings of the 50 largest US firms and the 50 “best places to work.” BCG suggests that companies need to put more attention to skill building and tracking its outcomes.
Of the analysed companies, 20% don’t include any mention of learning or skill building in their reports.
Skills aren’t linked to corporate strategy. Less than 15% of leaders believe that learning constitutes a core part of their company’s overall business strategy. Often, skill building is perceived as an HR initiative instead of being integral part of corporate strategy. From 24% of corporate reports which put skill-building in the context of corporate strategy, majority is describing its efforts in simple, quantitative ways. Only few companies indicate that they have a structured process of forecasting skills gaps.
Companies’ reporting on skill-building is limited. Companies monitor the process of learning, but few disclose the results they achieve. Most companies report on metrics like hours of training delivered or number of people who attended courses. But these numbers tell us very little about what is the outcome of learning. Only 4% of companies report on the outcomes of their skill-building programs in terms of business outcomes.
Skill building is typically described as an expense. Only 36% of companies report on the financial resource they dedicate to skill building. However, those who do it mostly position it as a cost rather than investment. Specifically, an investment in future capabilities. As long as learning budgets are considered costs, this spending is likely to have a lower priority than other investments. It’s not uncommon scenario that when there is a pressure on costs, the first thing to cut is learning and development budget.
Investors, regulators, and employees are interested in what a company does to future-proof the skills of the workforce. Since COVID, people topics are taken much more seriously, and it is only a matter of time until the skills topic is elevated to the strategic importance that it deserves.
Start with strong strategic intent. All companies need a plan to develop the skills required to deliver on their business strategy. It can start with a sharp articulation from the C-suite of how skill-building efforts tie to key strategic business priorities.
Allianz states in its 2021 sustainability report that “Digitalization and automation will change the composition of the future workforce with some job profiles no longer existing, new profiles and capabilities emerging, and considerable changes in existing profiles and skills. This will require major upskilling and reskilling initiatives to prepare the workforce for the future. Our main focus will be on developing digital, data and agile working skills. Skills like IT security, communications and HR will also be essential.”
Account for the will behind skill. Companies should position skill building among other investments. Employers can clearly dedicate a budget to strategic skill building and measure how it is spent. That will send a strong signal to the workforce that the company is investing in them.
Focus on outcomes over the process. Companies should focus on the right metrics.
By shifting the reported results from “number of employees trained” to “business and talent outcomes achieved,” companies can drive higher-order impact and keep the organization focused on skill-building investments. Business outcomes can be measured on multiple levels, such as looking at the application of learning at work (Did workers use the new technology? Did they exhibit new competencies?) or by looking at metrics of achievement (faster or cheaper production or greater sales). The assessment of outcomes should also focus on how learning improves the skills, capabilities, engagement, and employability of participants.
Inspire commitment, not compliance. Leaders should emphasize the importance and urgency of skill development for every individual including themselves. Leaders can encourage buy-in with stories of their own skill-building journeys.
Put skill building on the everyday agenda. Build lifelong learning culture in your organization by simple, yet regular reinforcements. For example, during regular touchpoints leaders can encourage team members to identify new skills to acquire.
Companies can count on two developments: the importance of a skilled and capable workforce will only increase, and the half-life of critical skills, particularly those related to advanced technology, will continue to shorten. The successful companies of the future will not only invest in human capital but also put the same level of effort and attention into tracking and reporting on skill building that they devote to investing in financial or tangible assets.
Source: https://www.bcg.com/publications/2023/your-strategy-is-only-as-good-as-your-skills
Want to be a Sponsor?
Would you like to be a sponsor of my newsletter? Contact me: sebastian@szachnowski.com.
Thank you for reading my newsletter! I’ll be delighted to get your feedback about the newsletter and this issue.
Do you know someone who might be interested in this newsletter? Share it with them.
You can also:
- Subscribe to my newsletter https://szachnowski.com/
- Connect with me on LinkedIn https://www.linkedin.com/in/sebastianszachnowski/
- Follow me on Twitter https://twitter.com/sszachnowski
- Send me an email sebastian@szachnowski.com