People Data Outside HR, Data Culture, and Predictive Analytics
Hi,
Wow, the time flies! It’s been 10 weeks since I wrote the first issue of my newsletter and today, I'm sending to you the issue #5!
For years HR has been treated as a cost center, but nowadays it should be recognized as a profit center. Employees are your company’s no. 1 asset. People data helps managers make right decisions and deliver profitable results for the company. Among companies advanced in people analytics, 54% reported achieving positive business outcomes from people analytics practice. However, to be successful at people analytics, you should combine people data with other data, and share people data with non-HR managers. Only then, the value will be enabled.
Table of contents:
- Report: Sharing People Data Outside HR to Drive Business Value
- Data Culture
- When to Use Predictive Analytics?
- Recommended Books
I hope you will enjoy this issue of my newsletter!
Report: Sharing People Data Outside HR to Drive Business Value
HR is at heart of value creation in business. Data-driven HR can help organizations achieve financial success and become a premier employer. This is achieved because modern metrics construct a picture revealing an understanding of how to lead people and how to lead the business forward. The more users of data the more insights taken into action. Transformation triggered by People Analytics means putting people data into the hands of managers for impactful decision making at every level. Companies are successful when their leaders are able to make informed decisions fast.
People analytics helps managers answer key questions such as “Do we have the necessary capacity to meet our annual plan?” “How should we reorient our production operations to ensure we have enough people to meet our targets?” and “Who of my highest performers is likely to resign?”
Advanced users of people analytics are those who are more strategically focused on the user of people data beyond simple reports and metrics and employ best practices or use people data to contribute to competitive advantage financially and as an employer of choice.
- 74% of companies advanced in people analytics use on-demand data to analyse the workforce proactively
- 54% of companies advanced in people analytics reported achieving positive business outcomes
- 50% of companies advanced in people analytics count people managers as consumers of data
Whether it’s burnout, a more competitive labor market, or the opportunity to reconsider their priorities, among other things, experts cite a complex array of forces for an ongoing power imbalance between employees and employers. As the new dynamics of the workplace continue to evolve, organizations are awakening to the idea that as the largest expense on the ledger, their workforces represent an essential investment whose experiences as employees play a key role in achieving results.
According to some researchers, employee experience (EX) has become the focal point to understand the workforce better. The EX definition has evolved from referring to non-engagement type of measures to employees’ collective perceptions of their ongoing interaction with the organization, including contact points with people, technology, processes, or other components. Employee value proposition expands and currently contains for example: career development, flexible work arrangements, DEI (diversity, equity, and inclusion), purpose, and compensation and benefits. With all of these it is harder to attract and retain talents. People analytics enables to show correlations between motivation and satisfaction of employees, and business productivity and business results.
Organizations are using people data to help non-HR managers better understand and address a wide array of challenges, from identifying high performers likely to resign, to matching recruiting and retention to the annual plan, to planning production operations to meet targets. Topics of interest often include turnover, diversity, pay equity, and total cost of the workforce.
Organization advanced in people analytics often pull data from more sources than just HR. They include the finance department and work productivity tools such as CRMs, email, and internal messaging apps, to get richer insights.
Adding listening data from employee satisfaction related conversations on work channels such as chat and email, organizational network analysis to discern patterns in employee communications, and other forms of continuous monitoring of employee sentiment enables organizations to access more rich and timely insights.
Putting people data into the hands of managers outside of HR requires a committed approach to educate the organization and to implement change management. Organizations most successful in people analytics ensure the proper support of senior executives inside and outside HR, secure alliance between HR and finance, and apply change management best practices. Ensuring people data is part of organization becoming more data-driven is important. Often, it starts with persuading HR managers that there is value in sharing people data outside of the function, or that there is sufficient data to be able to show value.
Relationship with finance is key in driving people analytics oriented on business value. Among organizations advanced in people analytics 59% count finance as consumers of people data. Early opportunity to forge strong relationship with the finance department is aligning on headcount/FTE numbers. They typically diverge because of differences in definitions and timing. That type of collaboration can help start winning over finance professionals.
Giving the right insights at the right time to the right person prevents overwhelming the user with data. Hand in hand with that approach is trying to make use of people data as easy and accessible as possible.
Despite sharing people data outside of HR is paying off, that sharing must be done with the right level of protection. Anonymizing and aggregating data, not sharing if particular data set or responding group is too small, protect identity and prevent disquieting situations. The information must be conveyed without revealing any particular sensitivities or private information about employees.
Deloitte found organizations that are high-performing in their use of people data are 1.6 times more likely than low-performing organizations to communicate to workers about the collection and use of personal data and 2.3 times more likely to provide workers with a choice to participate in data collection.
Mature users of people data democratize access to insights to drive people data informed decisions made by both HR and non-HR managers. These advanced users of people analytics report stronger financial performance in areas such as return on assets and profit margin and provide access to people data outside of HR in far greater number.
Source: https://hbr.org/sponsored/2022/11/sharing-people-data-outside-hr-to-drive-business-value
Data Culture
Data culture is a vague term and it’s hard to define it. Below is a definition from Tableau:
A Data Culture is the collective behaviors and beliefs of people who value, practice, and encourage the use of data to improve decision-making. As a result, data is woven into the operations, mindset, and identity of an organization. A Data Culture equips everyone in your organization with the insights they need to be truly data-driven, tackling your most complex business challenges.
Here are some questions to determine your data culture maturity and its development direction:
- What are you doing with data and how are you using analytics in your organisation?
- How mature is your use of data and analytics?
- How extensively is data used in planning and decision making?
- Who are the people working with data directly and indirectly?
- Who are your internal champions and what is their focus?
- What questions are people answering with data? How complex are these questions?
- How skilled are business people in using self-service solutions to find their own answers?
- What does data literacy look like in your organisation?
- How data literate and data conscious are your people?
- Are people trained and competent in using data and following basic principles of statistics?
- Does your leadership embrace data and the opportunities data brings for your organization?
- Are they guided by data in their decision making?
- Are they aware of and actively engaged in reducing biases in decision making?
Assess your status quo. What do you have? The list would include people with advanced data skills, subject matter experts, others who are eager to championing initiatives and colleagues in technology department who support and build the foundational technology. It also includes IT systems, training and collaboration platforms, and processes around data.
What is missing? For a start, identify your business pain points regarding data. It’s important to get input from others and achieve internal consensus before moving on.
Develop ideas. Now, together with key people you identified when you were assessing your status quo you can begin to create a plan how to move from where you are today to the future state you want to achieve. For example, if you want to build a more data literate workforce your focus will likely be around training programs, skill assessments and peer-to-peer training. Take the goals you want to achieve, break them down into actions and plan realistic way to getting there.
Start a pilot program. It’s always good idea to try something first before committing lots of resources, time and energy to it. If your goal is to build data literacy among your workforce, you might want to identify two internal champions who are keen to get involved in these initiatives. Make sure to share the outcomes with others, including the lessons learned and the plans for next steps.
Implement. Don’t overcommit. Maintaining a certain cadence of activities for a couple of months is fairly easy. Settling sustainable processes and culture is much harder. Persistence and consistency will pay off and over time. Be realistic, assess regularly and identify what delivers value and what doesn’t. Make changes accordingly.
If you don’t measure something, you cannot change it. How can you assess your data culture? Compare your starting point to the now.
Qualitative metrics:
- Number of people trained through internal and third-party training programs.
- Number of certifications achieved
- Number of analytical outputs created, for example new reports and analyses; self-service dashboards; number of reports reviewed and updated, etc.
- Adoption rate of technology across the business
Qualitative assessment:
- Self-reported job satisfaction by data professionals and employees in business departments
- Levels of collaboration
- Reduction of silos between departments
- Reduction of data silos
- Cross-functional projects started and completed
Source: https://medium.com/snowflake/defining-and-building-a-data-culture-b9299b768b9a
When to Use Predictive Analytics?
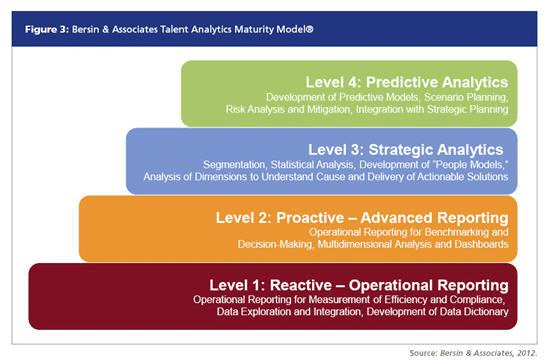
Predictive analytics has been originally placed on the top of people analytics model by Josh Bersin and since that time has become a buzzword. As with all other buzzwords we can discuss if by any means it pictures people analytics maturity (that was the original intention of the author). However, it cannot be overstated how this maturity model impacts the discussion of the value of predictive analytics in people analytics.
So when should you use predictive analytics?
Bring the minimum amount of complexity of analysis to answer the research question/hypotheses of your work that is possible. Only add complexity if it is necessary, adds value, and is considered important by stakeholders/customers; otherwise, stop.
To get to know when to use predictive analytics, we should first understand what predictive analytics is.
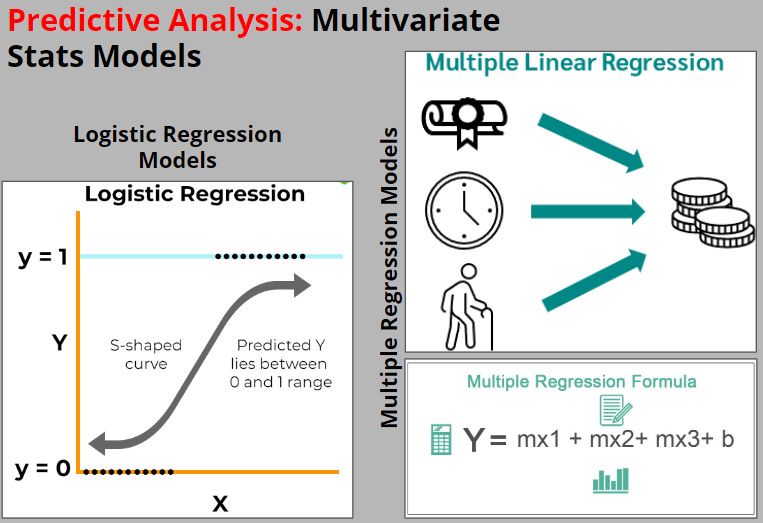
Multivariate models are statistical tools including linear regression and logistic regression. It uses multiple variables to predict outcomes.
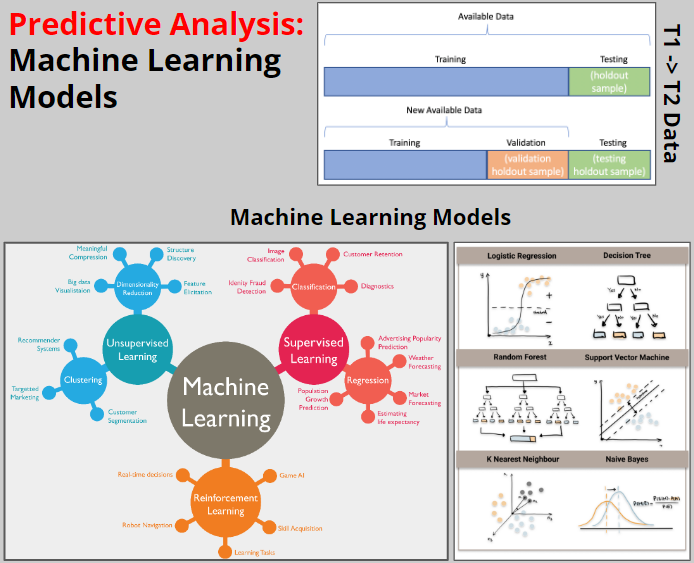
Machine learning models have many variants. In practice they take data from Time 1 and extrapolate it to make predictions in Time 2. This is done by training algorithms on Training and Test data at Time 1 to refine prediction, and then projecting the prediction onto Training, Validation, and Testing data at Time 2 with new data. Making predictions using machine learning models on Time 2 data, and validating the accuracy of such predictions, can be a reliable method for making future-based decisions.
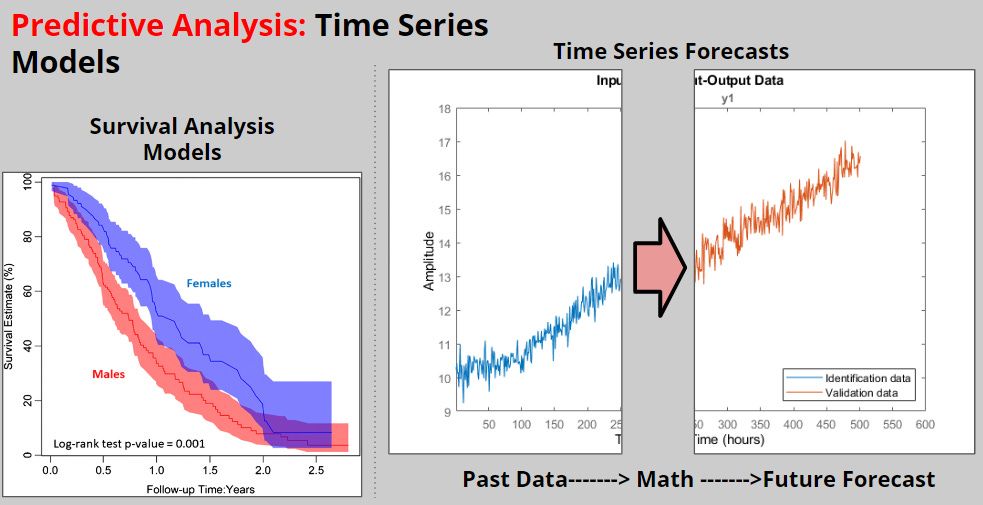
Time series models are used to forecast events based on verified historical data. Since the time is key element of a forecast it makes time series analysis different from other predictive models.
Forecasting is an estimation of a future events which one can make by incorporating and casting forward data related to the past in a pre-determined and systematic manner. Prediction is an estimate of future events made by subjective considerations.
Forecasts are made using time series data. Two commonly used time series models are ARIMAs and survival analysis.
In statistics and econometrics, and in particular in time series analysis, an autoregressive integrated moving average (ARIMA) model is a generalization of an autoregressive moving average (ARMA) model.
Survival analysis is a branch of statistics for analysing the expected duration of time until one event occurs, such as death in biological organisms and failure in mechanical systems.
The key to understanding time series analysis is that time, and its related components, are the variables that should influence the forecasts of the model. They do explain what the future should look like based on data from the past. To be accurate, the future has to be relatively stable and must look like the past, especially for these forecasts to be accurate.
The short answer to the question “when should you use predictive analytics?” is when you are trying to figure out what will happen.
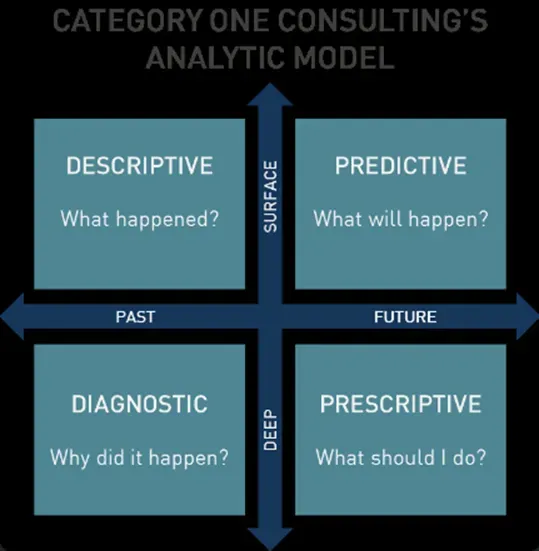
Multivariate models are commonly used in the academic and diagnostic context. They explain why something happened rather than what will happen. Common example is analysis of survey data to understand employee sentiment in relation to people turnover, burnout, or disengagement.
Machine learning models are the best to receive true, reliable, and accurate predictions. Popular example of machine learning is turnover prediction model. Other predictions that machine learning is used for are those based on commonly available data (like from HCM systems) and novel data (like Organizational Network Analysis, or Natural Language Processing): predicting potential for promotion of junior employees; predicting team effectiveness using multiple data sources, and many others.
Time series models are best used when forecasting a variable into the future where time is relevant to the forecast. For example, turnover rates can fluctuate based on the seasons or times of the year. Another interesting example is to use a forecast to act as a control group. Create a forecast of what turnover would have been if you did nothing to reduce turnover, and then conduct stay initiatives to see if the turnover rate drops outside the confidence interval of your original forecast.
Source: https://directionallycorrectnews.substack.com/p/people-analytics-primer-how-do-you
Recommended Books
The Power of People: Learn How Successful Organizations Use Workforce Analytics To Improve Business Performance, by Nigel Guenole, Jonathan Ferrar, Sheri Feinzig LINK
The Power of People shares lessons from people analytics practitioners and their insights.
Drawing on case studies and vignettes, this book helps you bring purpose and clarity to your workforce analytics projects. It describes the model of research design and analysis to get reliable insights. This book reveals where to start, where to find stakeholder support, and how to earn “quick wins” to build upon.
From this book you will learn how to establish sustainable practice of data management, technology usage, partnering, and skill building. Finally, you’ll discover how to earn even more value by establishing an analytical mindset throughout HR, and building two key skills: storytelling and visualization.
The Power of People is dedicated to HR executives establishing or leading analytics functions; HR professionals planning analytics projects; and any business executive who wants to get more value from HR.
Excellence in People Analytics: How to Use Workforce Data to Create Business Value, by Jonathan Ferrar, David Green LINK
Effectively and ethically leveraging people data to deliver real business value is what sets the best HR leaders and teams apart. Excellence in People Analytics provides business and human resources leaders with everything they need to know about creating value from people analytics.
This practical guide outlines how to create sustainable business value with people analytics and develop a data-driven culture in HR. It allows HR professionals and business executives to translate their data into tangible actions to improve business performance while navigating the rapidly evolving world of work.
Full of tools and advice assembled around the Insight222 Nine Dimensions in People Analytics® model, this book demonstrates how to use people data to increase profits, improve staff retention and workplace productivity as well as develop individual employee experience. It includes case studies from such companies as Microsoft, HSBC, Syngenta, Capital One, Novartis, Bosch, Uber, and Santander.
Excellence in People Analytics is recommended to all HR professionals needing to unlock the potential in their people data and gain competitive advantage.
Inspiring quote
“Working hard for something we don’t care about is called stress. Working hard for something we love is called passion.” – Simon Sinek
Thank you for reading my newsletter! I’ll be delighted to get your feedback about the newsletter and this issue.
Do you know someone who might be interested in this newsletter? Share it with them.
You can also:
- Subscribe to my newsletter https://szachnowski.com/
- Connect with me on LinkedIn https://www.linkedin.com/in/sebastianszachnowski/
- Follow me on Twitter https://twitter.com/sszachnowski
- Follow me on Instagram https://www.instagram.com/sszachnowski/
- Send me an email sebastian@szachnowski.com